🔢Introduction to Statistics
Introduction
Welcome to the fascinating world of statistics! Statistics is a branch of mathematics that deals with the collection, analysis, interpretation, presentation, and organization of data. It is a powerful tool that helps us understand the world around us, make informed decisions, and solve complex problems.
In this age of data-driven decision-making, statistics plays a crucial role across various disciplines, including data science, economics, psychology, biology, and more. It helps us make sense of the ever-growing volumes of data being generated every day and enables us to draw meaningful insights from them.
Statistics can be broadly categorized into two types:
Descriptive Statistics: This type of statistics deals with summarizing and organizing raw data to better understand the underlying patterns, trends, and relationships within the data. Descriptive statistics involves the use of measures of central tendency (mean, median, mode), measures of dispersion (range, variance, standard deviation), and graphical representations (histograms, bar charts, pie charts, etc.) to describe the data.
Inferential Statistics: Inferential statistics goes a step further by enabling us to make conclusions about a larger population based on a smaller sample of data. It uses techniques like hypothesis testing, confidence intervals, and regression analysis to make predictions, generalizations, and inferences about the population based on sample data.
As we embark on this journey to explore the fundamental concepts and techniques of statistics, you will gain an invaluable skillset that is essential for a data-driven world. By the end of this course, you will be equipped with the knowledge to tackle a wide range of problems using statistical methods, paving the way for a successful career in data science or any field where data analysis is critical.
Table of Contents
Introduction to Data Types in Statistics and Their Importance
Qualitative(Categorical) Data
Nominal Data
Ordinal Data
Quantitative(Numerical) Data
Discrete Data
Continuous Data
Probability Theory
Basic probability concepts
Probability Rules
Conditional Probability
Bayes' Theorem
Probability distributions (discrete and continuous)
Common distributions (uniform, binomial, normal..)
Introduction to Statistics and its Types
Descriptive Statistics
Measure of Central Tendency
Measure of Variability
Inferential Statistics
Estimation Estimation (point and interval)
Confidence Intervals
Hypothesis testing (null and alternative hypotheses, p-value, Type I and Type II errors)
Central Limit Theorem
Introduction to Data Types in Statistics
Data types play a crucial role in statistics as they form the foundation for applying statistical measurements accurately and drawing meaningful conclusions from data. Different data types require specific techniques for analysis and visualization, making it essential to understand which analysis and perception technique to use for each type. In general data science projects, Exploratory Data Analysis (EDA) becomes crucial as specific statistical measurements are specific to certain data types.
Qualitative Data
Qualitative data is information that cannot be quantified, measured, or easily expressed using numbers. It is typically collected from text, audio, and images and can be visualized through various tools such as word clouds, concept maps, graph databases, timelines, and infographics. There are two types of qualitative data, nominal data, and ordinal data.
Nominal Data:
Nominal data is a type of qualitative data used to label variables without assigning quantitative values. The term "nominal" comes from the Latin word “nomen,” meaning "name." Nominal data is often referred to as "labels" since it only names things without applying any particular order. Examples of nominal data include gender, hair color, and marital status. Nominal data has no intrinsic ordering, and the categories cannot be ranked in any specific order.

Ordinal Data:
Ordinal data is the second type of qualitative data and is different from nominal data in that it shows where a number is present in a specific order. Ordinal data is placed in some kind of order, indicating superiority or inferiority, and can be assigned numbers based on their relative position. However, arithmetic operations cannot be performed on ordinal data because they only show the sequence. Ordinal variables are considered "in-between" qualitative and quantitative variables. Examples of ordinal data include the ranking of users in a competition, rating of a product on a scale of 1-10, and economic status.
Understanding data types and their characteristics is essential in the field of statistics for accurate data analysis, interpretation, and visualization. By understanding data types and their unique features, data analysts can select the appropriate tools and methods to analyze and visualize data effectively.

Quantitative Data
Quantitative data is a type of data that can be measured and expressed using numbers. It includes both continuous and discrete data types. While qualitative data provides insight into the characteristics of a particular population or phenomenon, quantitative data allows us to make objective, numerical comparisons between different groups or variables.
Discrete Data
Discrete data is a type of quantitative data that can only take on whole, distinct values and cannot be subdivided into smaller parts. This type of data involves only integers, and we cannot count values like 2.5 or 3.75. Discrete data has a limited number of possible values and can be measured using a counting process. Examples of discrete data include the number of students in a class, the number of workers in a company, and the number of test questions you answered correctly.
Discrete data is different from continuous data, which can take on any value within a certain range. Understanding the difference between these data types is crucial in selecting the appropriate statistical methods for analysis and visualization.

Continuous Data:
Continuous data is a type of quantitative data that can take on any value within a certain range and can be measured on a scale or continuum. This type of data can have almost any numeric value and can be measured with great precision using different units of measurement. Examples of continuous data include the height of individuals, the temperature of a room, and the time required to complete a project.
The key difference between continuous and discrete data is that continuous data can be measured at any point along a range of values, whereas discrete data can only take on distinct, whole values. Continuous variables can take any value between two numbers, and there are an infinite number of possible values within a given range. For example, between the range of 60 and 82 inches, there are millions of possible heights that can be measured, such as 62.04762 inches, 79.948376 inches, and so on.
A good rule of thumb for determining whether data is continuous or discrete is to consider whether the point of measurement can be divided in half and still make sense. If it can, then the data is likely continuous.
Understanding the difference between continuous and discrete data is essential in selecting appropriate statistical methods for analysis and visualization.
For more detail, please see the following website
Probability Theory
Probability theory is the branch of mathematics that studies the likelihood of various events occurring. It provides a framework for modeling and understanding random phenomena, and is essential for making predictions and informed decisions in the face of uncertainty.
Basic Concepts
Probability: A measure of how likely it is that a particular event will occur, expressed as a number between 0 and 1. A probability of 0 indicates that the event is impossible, while a probability of 1 means that the event is certain.
Experiment: An action or process with an uncertain outcome, such as flipping a coin, rolling a die, or drawing a card from a deck.
Sample Space: The set of all possible outcomes of an experiment, usually denoted by the letter S. For example, the sample space for a coin flip is S = {Heads, Tails}.
Event: A subset of the sample space, representing one or more specific outcomes. For example, in the experiment of rolling a die, an event could be "rolling an even number" or "rolling a number greater than 4".
Probability Rules
The probability of an event occurring is always between 0 and 1, inclusive: 0 ≤ P(A) ≤ 1.
The probability of the entire sample space is 1: P(S) = 1.
The probability of an event not occurring (complementary event) is given by: P(A') = 1 - P(A).
If two events A and B are mutually exclusive (cannot occur at the same time), the probability of either event occurring is: P(A ∪ B) = P(A) + P(B).
If two events A and B are independent (the occurrence of one does not affect the probability of the other), the probability of both events occurring is: P(A ∩ B) = P(A) * P(B).
Conditional Probability
Conditional probability is the probability of one event occurring given that another event has already occurred. The conditional probability of event A occurring given that event B has occurred is denoted as P(A|B) and is given by: P(A|B) = P(A ∩ B) / P(B), provided that P(B) > 0.
Bayes' Theorem
Bayes' theorem is a fundamental result in probability theory that relates the conditional probabilities of two events. It is given by: P(A|B) = [P(B|A) * P(A)] / P(B), provided that P(B) > 0.
Probability Distributions
A probability distribution is a function that describes the likelihood of different outcomes for a random variable. There are two types of probability distributions:
Discrete Probability Distribution: A distribution for discrete random variables, which can take on a finite or countably infinite number of possible values. Examples include the uniform distribution, binomial distribution, and Poisson distribution.
Continuous Probability Distribution: A distribution for continuous random variables, which can take on any value within a continuous range. Examples include the normal (Gaussian) distribution, exponential distribution, and uniform distribution on a continuous interval.
Common Probability Distributions
Uniform Distribution: A distribution where all outcomes in the sample space are equally likely. This distribution can be discrete, where each outcome has an equal probability, or continuous, where the probability density is constant over a specified range.
Binomial Distribution: A discrete distribution that models the number of successes in a fixed number of Bernoulli trials (independent experiments with binary outcomes, such as success or failure). The binomial distribution is characterized by two parameters: the number of trials (n) and the probability of success (p) in each trial.
Normal Distribution: A continuous distribution characterized by its bell-shaped curve, also known as the Gaussian distribution. It is defined by two parameters: the mean (µ) and the standard deviation (σ). The normal distribution is often used to approximate other distributions due to the Central Limit Theorem, which states that the sum of a large number of independent and identically distributed random variables converges to a normal distribution.
Poisson Distribution: A discrete distribution that models the number of events occurring in a fixed interval of time or space, given a constant average rate of occurrence (λ). The Poisson distribution is often used to model rare events, such as the number of phone calls received at a call center per hour or the number of accidents at an intersection per year.
Exponential Distribution: A continuous distribution that models the time between events in a Poisson process. The exponential distribution is characterized by a single parameter, the rate (λ), which is the inverse of the mean time between events.
Other Distributions: There are many other probability distributions used in statistics, such as the chi-square, t-distribution, and F-distribution, which are often used in hypothesis testing and estimation. Each distribution has specific properties and applications, making it useful for modeling different types of data and solving various problems.
Understanding these common probability distributions and their properties is crucial for selecting the appropriate model for a given data set and making inferences about the underlying population. As you continue your studies in statistics and data science, you will encounter these distributions frequently and apply them to a wide range of problems.
In conclusion, probability theory is a fundamental aspect of statistics and data science, as it provides the mathematical foundation for understanding and quantifying uncertainty in real-world phenomena. By studying probability theory, we can better model and make predictions about random events, which is essential for making informed decisions in various fields, from finance to medicine, engineering, and social sciences.
We have covered the basic concepts and rules of probability, conditional probability, Bayes' theorem, and common probability distributions. These core principles are crucial for a deeper understanding of more advanced statistical techniques, such as hypothesis testing, estimation, and regression analysis.
As you continue your exploration of statistics and data science, you will find that probability theory is at the heart of many methods and models, enabling us to draw insights from data and navigate the inherent uncertainty in our world.
Introduction to Statistics and its Types
Statistics is the field of mathematics that focuses on the collection, organization, analysis, interpretation, and presentation of numerical data. It is a form of mathematical analysis that utilizes various quantitative models to generate experimental data or examine real-life scenarios. Statistics is considered an applied mathematical discipline that is concerned with how data can be used to address complex problems. Some scholars view statistics as a distinct mathematical science, rather than a mere branch of mathematics.
Statistics simplifies complex data and provides a clear, concise representation of the information collected, making it easier to understand and analyze. It plays a vital role in various fields, including business, economics, and scientific research, as it helps inform decision-making processes and generate insights from data.
Basic Terminology in Statistics:
Population: A population is the complete set of individuals, objects, or events that share a common characteristic and are the subject of analysis. In statistics, the population represents the entire group of interest, from which we draw conclusions and make generalizations. Populations can be finite or infinite, depending on the context and the subject of study.
Sample: A sample is a subset of a population, which is selected to represent the entire population in a statistical analysis. The primary goal of sampling is to obtain a smaller, manageable group of data points that accurately reflects the characteristics of the larger population. By analyzing the sample, researchers can make inferences about the population as a whole without the need to collect data from every individual or event in the population.
In summary, statistics is a vital field of mathematics that deals with the collection, analysis, interpretation, and presentation of numerical data. It provides valuable insights and simplifies complex information, making it easier to understand and work with. The fundamental concepts in statistics include populations and samples, which are essential to conducting statistical analyses and drawing meaningful conclusions.
Types of Statistics :
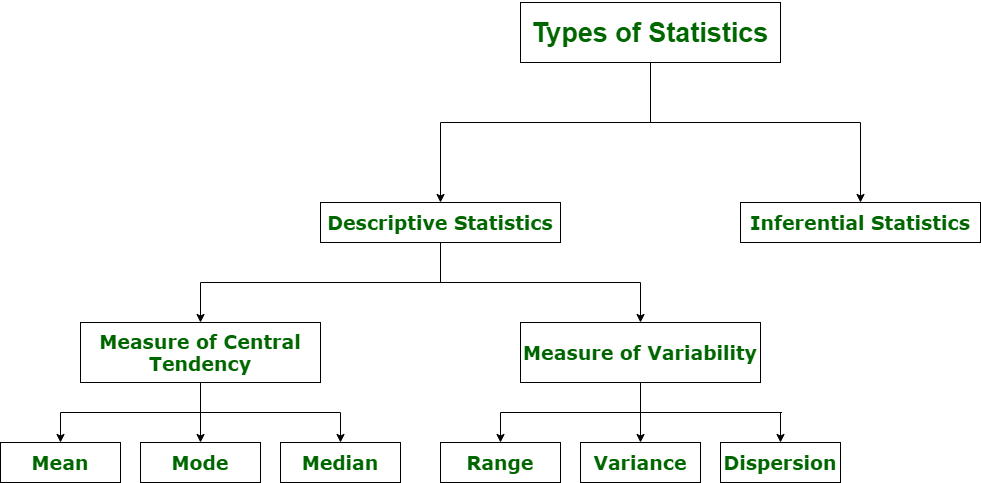
1.Descriptive Statistics
Descriptive statistics is the branch of statistics that focuses on summarizing, organizing, and presenting data in a clear and understandable manner. It provides a way to describe the main features of a dataset using numerical measures, graphical displays, or summary tables. Descriptive statistics do not involve making inferences or predictions about a larger population based on a sample; rather, they aim to provide an accurate representation of the data collected for the given sample or population.
Common descriptive statistics techniques include measures of central tendency (such as mean, median, and mode), measures of dispersion (such as range, variance, and standard deviation), and measures of shape (such as skewness and kurtosis). Graphical displays, such as histograms, bar charts, pie charts, and box plots, are also used to visually represent data and identify patterns or trends.
In summary, descriptive statistics is the process of summarizing and presenting data in an easily interpretable way, providing a comprehensive overview of the main features and characteristics of a dataset.
(a). Measure of central tendency Measure of central tendency is also known as summary statistics that is used to represents the center point or a particular value of a data set or sample set. In statistics, there are three common measures of central tendency as shown below:
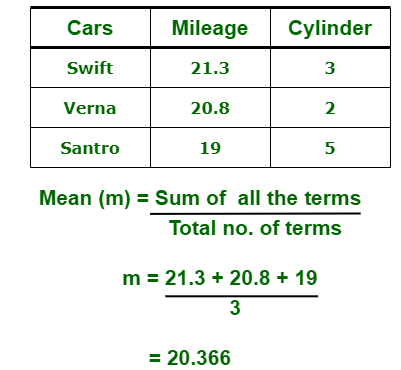
(i) Mean : It is measure of average of all value in a sample set. For example,
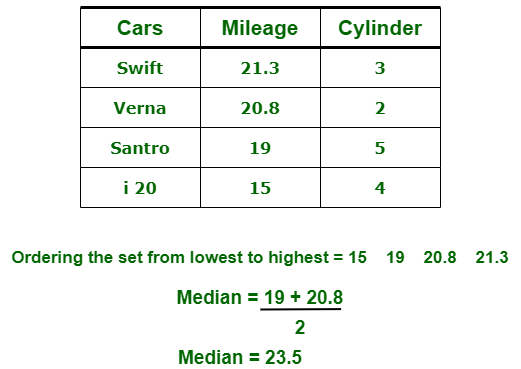
(ii) Median : It is measure of central value of a sample set. In these, data set is ordered from lowest to highest value and then finds exact middle. For example,
(iii) Mode : It is value most frequently arrived in sample set. The value repeated most of time in central set is actually mode. For example,

(b) Measure of Variability Measure of Variability is also known as measure of dispersion and used to describe variability in a sample or population. In statistics, there are three common measures of variability as shown below:
(i) Range : It is given measure of how to spread apart values in sample set or data set.
(ii) Variance : It simply describes how much a random variable defers from expected value and it is also computed as square of deviation.
In these formula, n represent total data points, ͞x represent mean of data points and x_i represent individual data points.
(iii) Dispersion : It is measure of dispersion of set of data from its mean.
2. Inferential Statistics
Inferential statistics allow us to make conclusions about a population based on a sample taken from that population. By analyzing the sample, we can generalize our findings to the larger population. The two main branches of inferential statistics are estimation and hypothesis testing
Estimation
Estimation is the process of determining the value of a population parameter based on the information obtained from a sample. There are two types of estimation: point estimation and interval estimation.
Point estimation: A point estimate is a single value that serves as the best guess for the population parameter. For example, the sample mean can be used as a point estimate of the population mean. However, point estimates do not provide any information about the uncertainty or variability of the estimate.
Interval estimation: An interval estimate, also known as a confidence interval, provides a range within which the population parameter is likely to fall. Confidence intervals are typically expressed with a confidence level, which indicates the probability that the interval contains the true population parameter. For example, a 95% confidence interval means that if we were to take multiple samples and calculate confidence intervals for each sample, approximately 95% of those intervals would contain the true population parameter.
Confidence Intervals
A confidence interval is an interval estimate that provides a range of values within which the population parameter is likely to fall. The confidence level associated with the interval represents the probability that the interval contains the true population parameter. The confidence interval is calculated using the point estimate, the standard error of the estimate, and a critical value that depends on the chosen confidence level and the underlying probability distribution. For example, for a normally distributed population, the critical value is the z-score that corresponds to the desired confidence level.
Hypothesis Testing
Hypothesis testing is a method of statistical inference used to make decisions or draw conclusions about a population based on sample data. It involves formulating null and alternative hypotheses, calculating a test statistic, and comparing the test statistic to a critical value or calculating a p-value to determine the statistical significance of the observed results.
Null hypothesis (H0): The null hypothesis is a statement that assumes no effect or relationship between variables. It represents the status quo or the default assumption, and it is the hypothesis that we are trying to find evidence against.
Alternative hypothesis (H1 or Ha): The alternative hypothesis is a statement that contradicts the null hypothesis. It represents the effect or relationship that we are trying to find evidence for.
P-value: The p-value is the probability of observing the test statistic, or a more extreme value, under the assumption that the null hypothesis is true. A small p-value (typically less than a predefined significance level, such as 0.05) indicates that the observed results are unlikely to have occurred by chance alone, and we reject the null hypothesis in favor of the alternative hypothesis.
Type I error (α): A Type I error occurs when we incorrectly reject the null hypothesis when it is true. The probability of committing a Type I error is denoted by the significance level, α.
Type II error (β): A Type II error occurs when we fail to reject the null hypothesis when it is false. The probability of committing a Type II error is denoted by β. The power of a test is defined as 1 - β, which represents the probability of correctly rejecting the null hypothesis when it is false.
In summary, inferential statistics provide a way to make conclusions about a population based on sample data. By using estimation and hypothesis testing, we can quantify the uncertainty associated with our estimates and make informed decisions based on the available evidence.
Types of inferential statistics
Inferential statistics is a branch of statistics that focuses on drawing conclusions about a population based on a sample taken from that population. Several techniques are used to make inferences, test hypotheses, and estimate population parameters. Here are some common types of inferential statistics:
One Sample Test of Difference/One Sample Hypothesis Test: This test is used to compare the sample mean to a known population mean or a hypothesized value. The most common one-sample tests are the one-sample t-test and the one-sample z-test. These tests are used to determine if there is a significant difference between the sample mean and the hypothesized population mean.
Confidence Interval: A confidence interval is a range of values within which the true population parameter is likely to fall. It is calculated using the sample statistic, the standard error, and a critical value based on the desired level of confidence. Confidence intervals provide an estimate of the uncertainty associated with the population parameter.
Contingency Tables and Chi-Square Statistic: Contingency tables, also known as cross-tabulation or crosstabs, display the frequencies of categorical variables. The chi-square statistic is used to test the association between two categorical variables in a contingency table. It measures the difference between the observed frequencies and the frequencies that would be expected under the assumption of independence between the variables.
T-test or ANOVA: T-tests and analysis of variance (ANOVA) are used to compare the means of two or more groups. The t-test is used for comparing the means of two independent groups, while ANOVA is used for comparing the means of three or more groups. Both tests are used to determine if there are statistically significant differences between the group means.
Pearson Correlation: The Pearson correlation coefficient measures the strength and direction of the linear relationship between two continuous variables. It ranges from -1 (perfect negative correlation) to 1 (perfect positive correlation). A Pearson correlation coefficient of 0 indicates no linear relationship between the variables.
Bivariate Regression: Bivariate regression is a type of linear regression that involves two variables – one independent variable and one dependent variable. It estimates the relationship between the two variables by fitting a straight line (regression line) that minimizes the sum of the squared differences between the observed values and the predicted values based on the line.
Multivariate Regression: Multivariate regression, also known as multiple linear regression, is an extension of bivariate regression that involves multiple independent variables. It is used to model the relationship between a dependent variable and two or more independent variables. It estimates the coefficients for each independent variable to best predict the dependent variable.
These are some of the widely used inferential statistics techniques that help in making conclusions, predictions, and generalizations about a population based on a sample.
Central Limit Theorem
If you are a part of machine learning world, you will certainly be familiar with the term central limit theorem commonly know as CLT. This theorem makes data scientist life simple but often misunderstood and is mostly confused with the law of large numbers. It is a powerful statistical concept that every data scientist MUST know. Now, why is that? Let’s see!!!
Why should you read this subsection? After completion you will know:
The CLT describes the shape of the distribution of sample means as a Gaussian commonly known as normal distribution, which is very popular in statistics.
An example of simulated dice rolls in Python to demonstrate the central limit theorem.
And finally with CLT knowledge of the Gaussian distribution is used to make inferences about model performance in applied machine learning.
Central Limit Theorem
Before going to statistical definition lets consider an example to understand better.
The Central Limit Theorem (CLT) is a fundamental concept in statistics that states that the distribution of the sample means of a sufficiently large number of independent and identically distributed random variables approaches a normal distribution, regardless of the shape of the original population distribution.
To illustrate the Central Limit Theorem, let's consider the example of calculating the average marks scored by computer science students in India in the Data Structure subject.
One approach would be to collect every student's marks, sum them, and then divide by the total number of students to find the average. However, this process would be time-consuming and impractical for a large population.
An alternative approach, based on the Central Limit Theorem, involves the following steps:
Draw multiple random samples from the population, each consisting of a specific number of students (e.g., 30). These subsets of the population are called samples.
Calculate the mean of each sample.
Calculate the mean of these sample means.
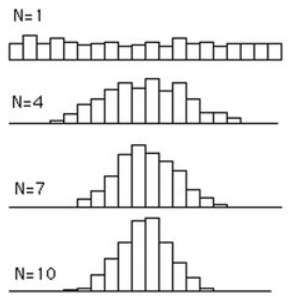
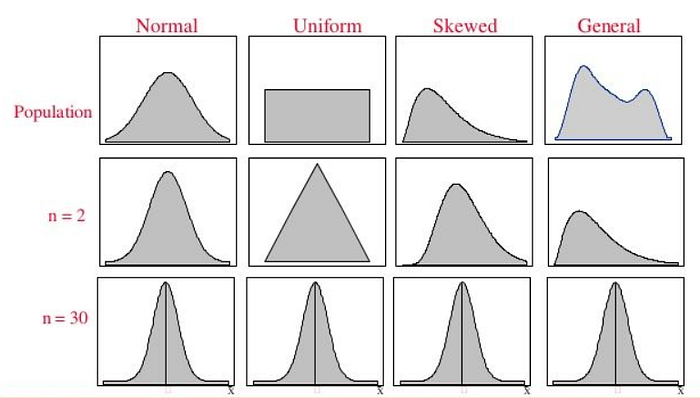
According to the Central Limit Theorem, this value will provide an approximate mean of the population (average marks of the computer science students in India). Moreover, the distribution of the sample means will approach a normal distribution (a bell curve) as the sample size increases. This holds true regardless of the shape of the original population distribution, provided the sample size is sufficiently large (typically n > 30). If the population has a normal distribution, the Central Limit Theorem will hold even for smaller sample sizes.
In conclusion, the Central Limit Theorem is a powerful tool in statistics that allows us to make inferences about a population using a manageable sample size. It simplifies complex problems by enabling the use of normal distribution properties for various statistical analyses.
Formal definition :
The central limit theorem in statistics states that, given a sufficiently large sample size, the sampling distribution of the mean for a variable will approximate a normal distribution regardless of that variable’s distribution in the population.
Unpacking the definition, Irrespective of the population distribution if samples size is sufficient. The distribution of sample means, calculated from repeated sampling, will tend to normality as the size of your samples gets larger.
Formula:
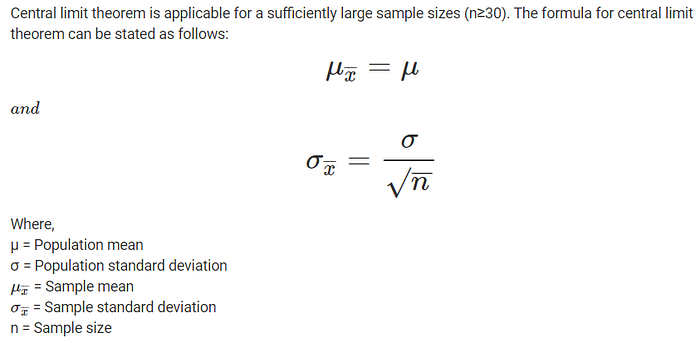
It is important that each trial that results in an observation be independent and performed in the same way. This is to ensure that the sample is drawing from the same underlying population distribution. More formally, this expectation is referred to as independent and identically distributed, or iid.
Firstly, the central limit theorem is impressive, especially as this will occur no matter the shape of the population distribution from which we are drawing samples. It demonstrates that the distribution of errors from estimating the population mean fit a distribution that the field of statistics knows a lot about.
Secondly, this estimate of the Gaussian distribution will be more accurate as the size of the samples drawn from the population is increased. This means that if we use our knowledge of the Gaussian distribution in general to start making inferences about the means of samples drawn from a population, that these inferences will become more useful as we increase our sample size.

END OF THE LECTURE
Last updated
